In this blog, I will introduce a new feature released in Dynamics 365 Business Central 2021 Wave 2 (version 19). A profiling editor view in Visual Studio Code to monitor processes in order to improve performance times.
Configuration
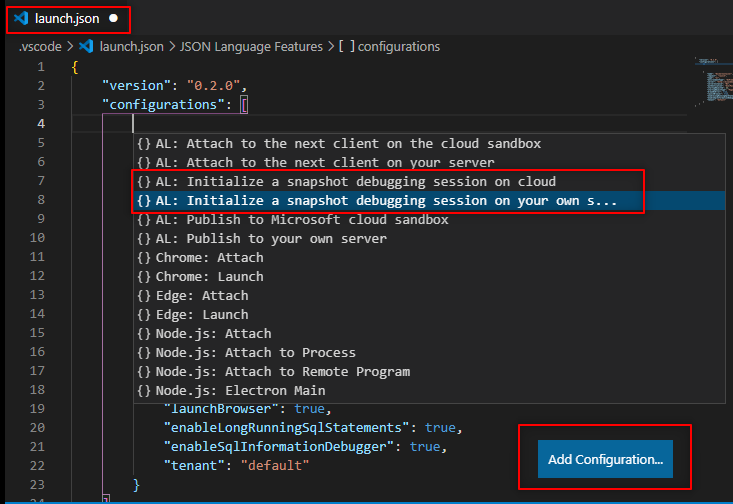
To use it, first, we need to add the configuration in our ‘launch.json’. It can be for the cloud or locally. For this example, I will use my own server.
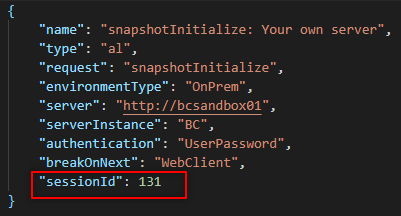
Then, you need to specify a ‘sessionId’ or ‘userId’ to perform the test. I will use the ‘sessionId’.
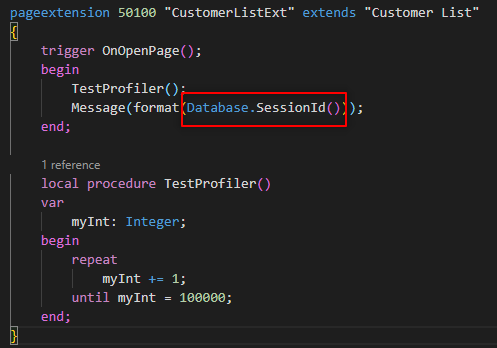
A quick way for getting the ‘sessionId’ onPrem is to use ‘Database.SessionId()’. For cloud, you can use the Admin Center. I also created a small loop to test performance time:
Steps
The steps to perform the snapshot debugging are the following:
- Get the ‘sessionId’.
- Save launch.json with this Id.
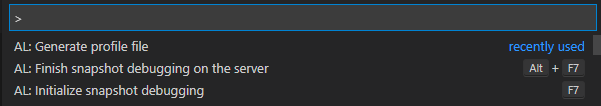
- Initialize snapshot debugging. (F1 + AL: Initialize snapshot debugging).
- Perform your test.
- Finish snapshot debugging. (F1 + AL: Finish snapshot debugging on the server).
- Generate profile file. (F1 + AL: Generate profile file).
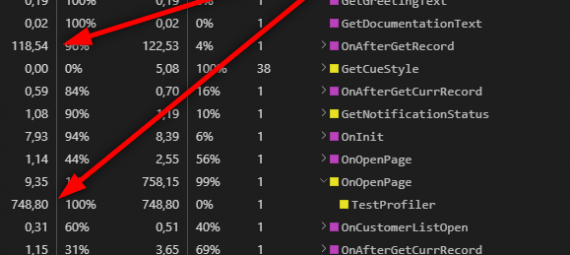
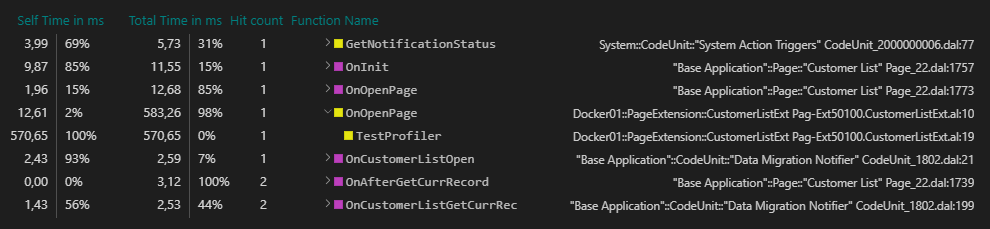
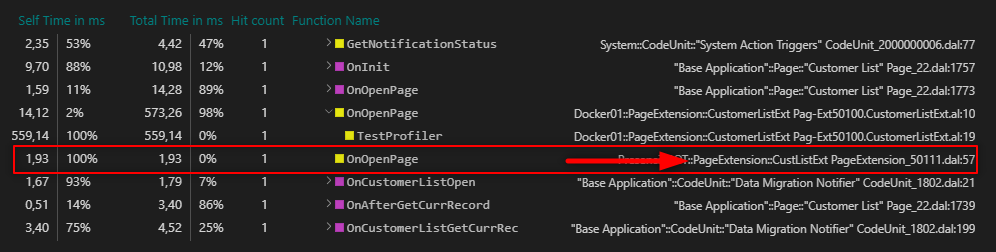
Finally, we can see the results, our little loop ‘TestProfiler’ took 570,65 ms. We can see all the events and procedures in order of execution:
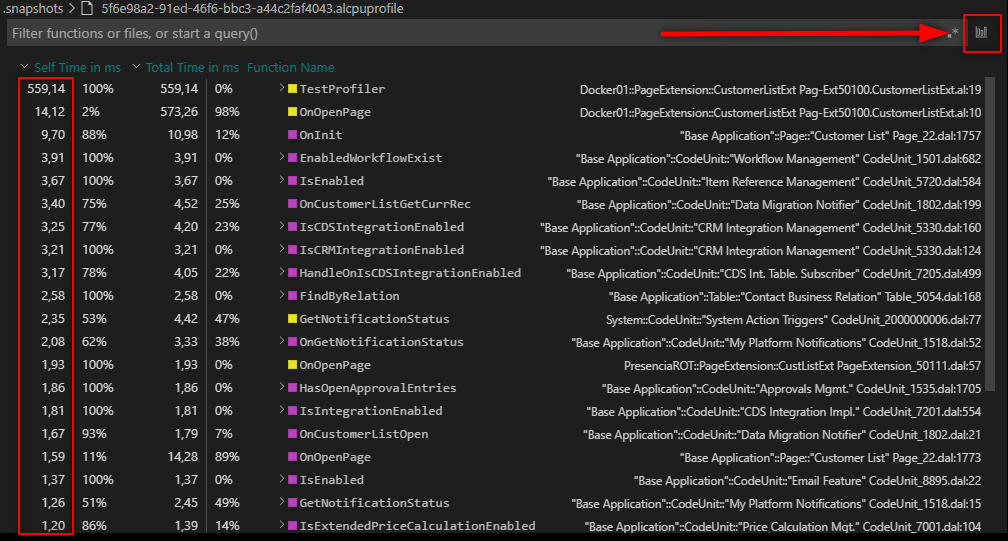
With the ‘bottom up view’ you have the most time-consuming on top in ascending order:
Video test of the whole process:
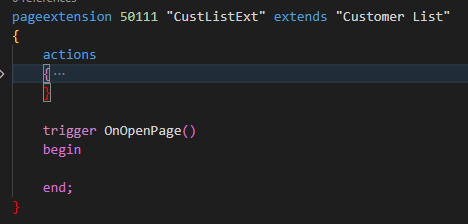
By chance, in other .app I had an empty trigger on the Customer List, I realized that although there is no code inside, the trigger is executing anyways. You can see below that it took just 1,93 ms but in a long process everything adds up.
Hope you find it useful and start using it to achive better performance times.
That´s all.